OEE fundamentals
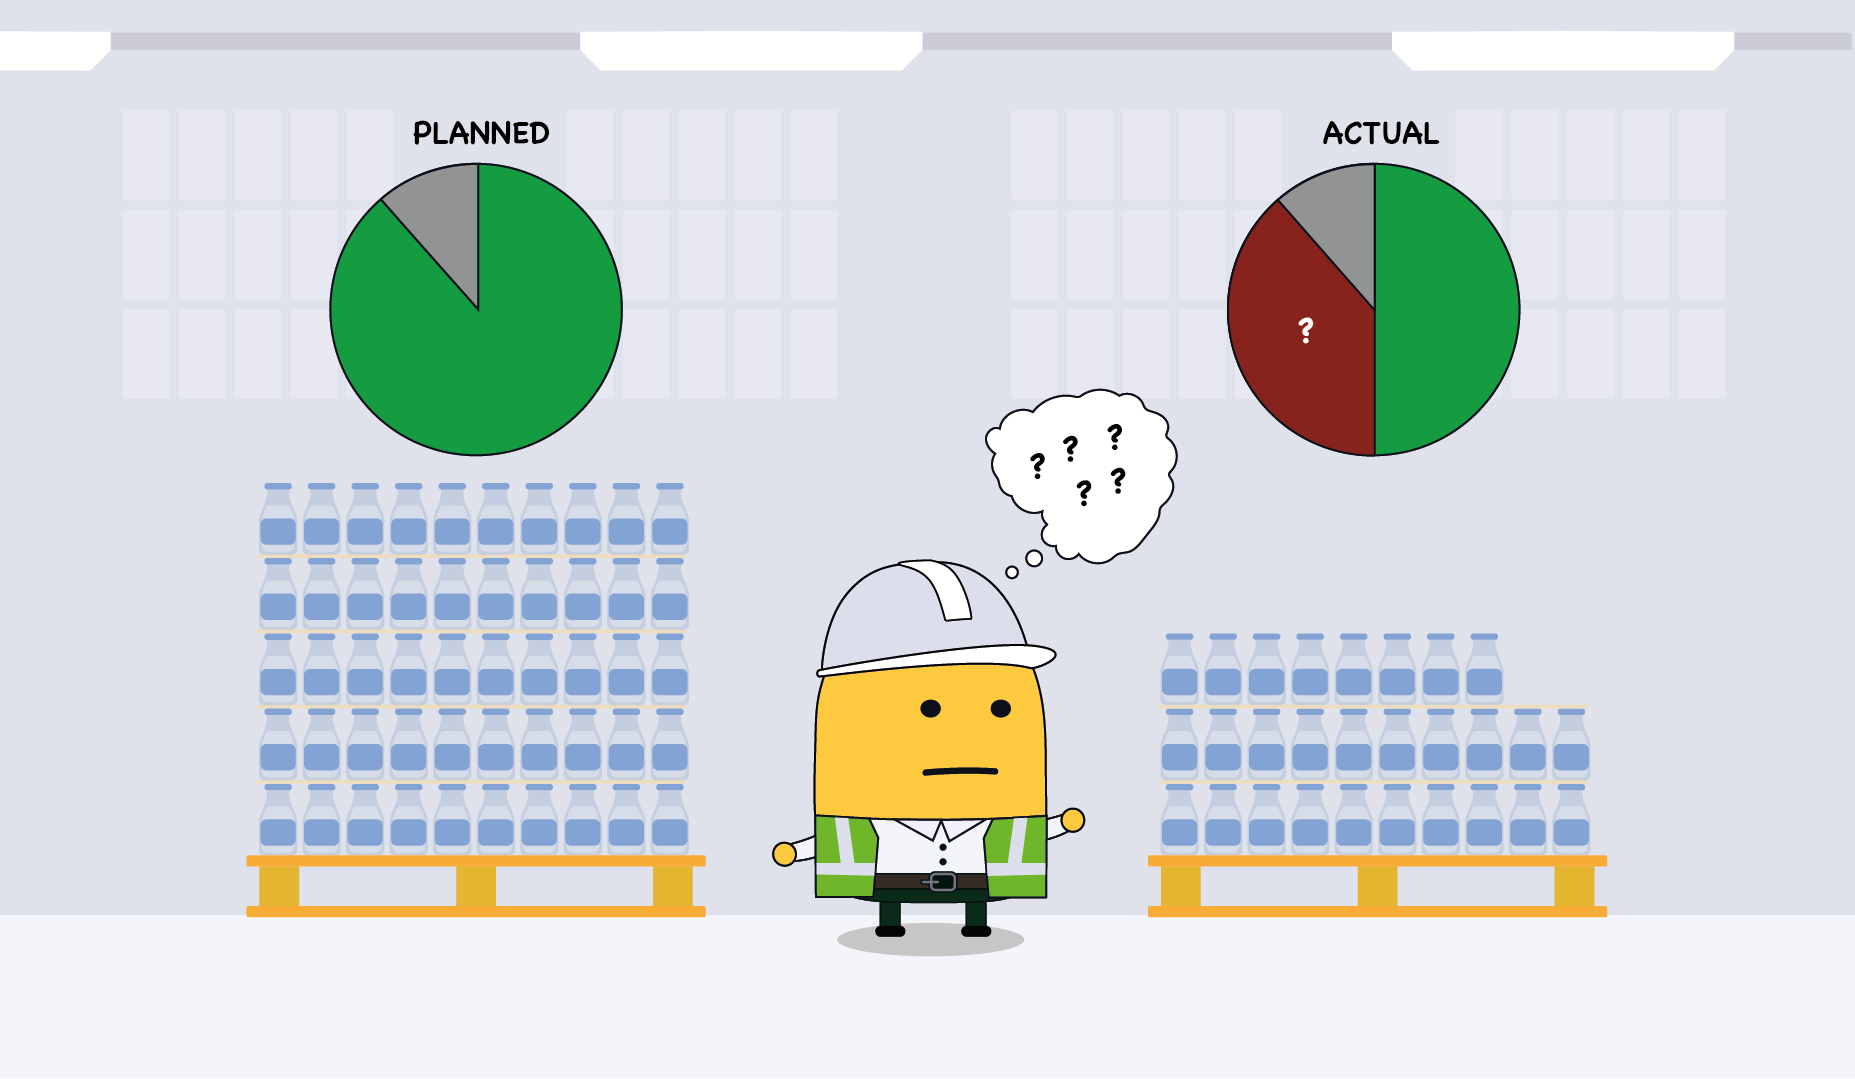
Overall Equipment Effectiveness (OEE) is a widely recognized metric in manufacturing that helps measure how effectively equipment is being utilized. It provides a comprehensive view of productivity by combining three core factors: Availability, Performance, and Quality. By evaluating these components, OEE helps manufacturers understand the percentage of manufacturing time that is truly productive.
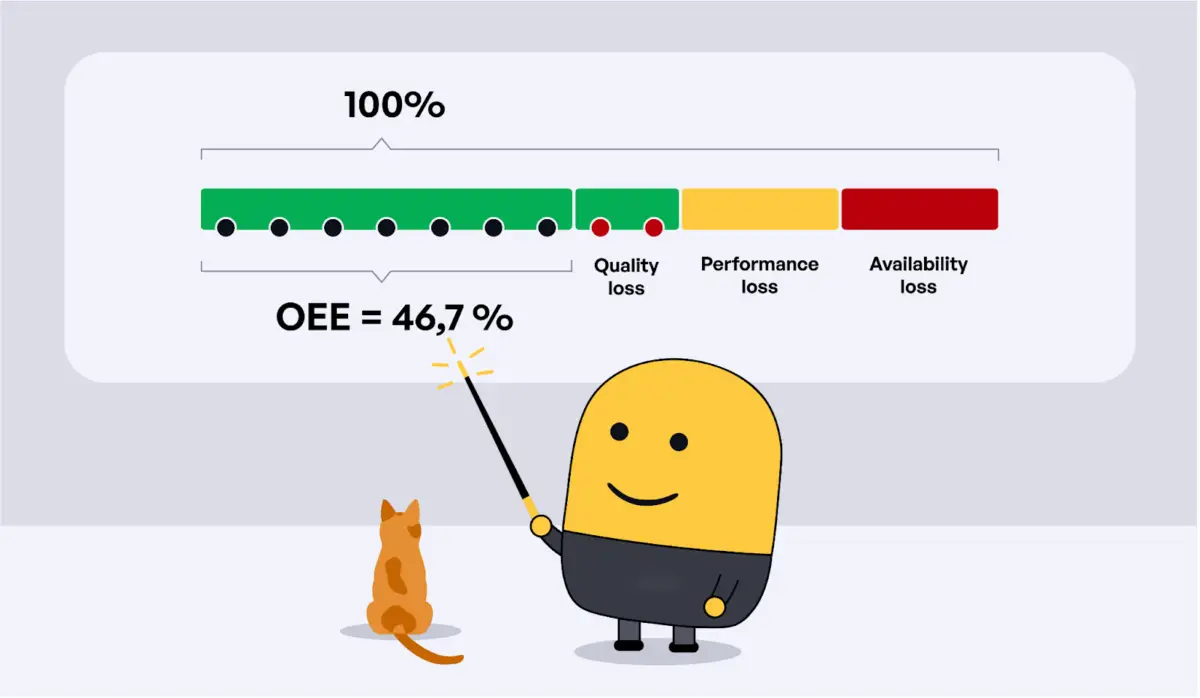
Availability refers to the percentage of planned production time during which the equipment is actually running. It takes into account any unplanned stops such as breakdowns or setup time. When machines are not operating during scheduled time, it leads to a loss in availability. The next component, Performance, measures whether the equipment is operating at its maximum possible speed. Any deviation from the ideal cycle time, including slow cycles or small stops, affects performance. Lastly, Quality represents the percentage of good parts produced out of the total output. It accounts for any losses due to defective products or rework.
When these three factors are multiplied together, they yield the OEE score, which provides a clear indicator of manufacturing effectiveness. An OEE score of 100% signifies perfect production – only good parts, as fast as possible, with no downtime. While 85% is considered world-class performance, many manufacturers operate at around 60%, indicating potential for improvement. Regularly tracking OEE helps identify inefficiencies, reduce downtime, and improve productivity. It fosters a data-driven culture on the shop floor and supports continuous improvement efforts by highlighting the exact areas that need attention.
Improving OEE requires a strategic approach, including minimizing equipment downtime, optimizing setup and changeover times, maintaining machines proactively, ensuring consistent quality output, and training operators effectively. When used correctly, OEE becomes more than just a performance metric – it transforms into a powerful tool for driving lean manufacturing and achieving operational excellence.
Overall Equipment Effectiveness (OEE) is one of the most popular metrics in manufacturing. It offers a straightforward formula to assess how well your manufacturing process is performing. But heres the truth: OEE is also one of the most frequently manipulated metrics on the shop floor, sometimes intentionally, often unintentionally.
What Is OEE, Really?
OEE measures how effectively a piece of manufacturing equipment is used, based on three components:
- Availability : What percentage of the scheduled time is the equipment actually running?
- Performance : How fast is the equipment running compared to its maximum capable speed?
- Quality : What percentage of parts produced are good the first time?
In simple terms, it tells you what portion of production time is being used to make good products, as quickly as possible, without interruptions.
1. Manipulating the Time Base
The time base is the starting point for calculating availability and it’s also the easiest place to manipulate. If you reduce the total “scheduled” time, even mediocre performance can look great.
Common manipulation tactics:
- Excluding scheduled maintenance from the available time
- Ignoring breaks, especially if production continues in some form
- Labeling unplanned stoppages as “scheduled downtime” to avoid counting them as losses
- Not including setup/changeover time
- Excluding overtime, even when machines keep running after a normal shift
Each of these tactics can inflate your OEE by 5–15% or more, without any real performance gains.
2. Manipulating the Speed Baseline
Performance is measured against the equipment’s “Maximum Demonstrated Rate” (MDR) — the highest reliably achieved speed. But this benchmark is highly susceptible to manipulation.
How the speed baseline gets skewed:
- Using the average speed of a “good day” as the MDR, even though it still includes losses
- Referring to outdated speed benchmarks, despite recent process improvements
- Underestimating operator capability, especially when performance targets are tied to bonuses
- Padding standard cycle times with built-in allowances for “unforeseen delays,” particularly when using predetermined motion systems like REFA or MTM
The result? You might see “performance” scores of 110% or more — a physical impossibility. That’s a sign your speed baseline has been artificially lowered.
3. Manipulating the Count of Good Products
Though it’s harder to fake production output, quality numbers still get manipulated. Tactics include:
- Falsifying production counts, especially when there’s no cross-check or system validation
- Assigning output to favored operators (“hero workers” or Stakhanovism) to boost personal metrics
- Failing to record rejects — or worse, counting bad parts as good
Quality issues are often the hardest to track accurately. But when they’re missed, OEE is significantly distorted.
What Real OEE Looks Like?

When done right, OEE reveals the real story of your operations — strengths and weaknesses alike. The reality? Most factories are far from perfect.
Why Transparency Matters
Manipulated OEE helps no one. It masks problems, builds false confidence, and blocks improvement. Yet, we regularly see factories reporting OEE scores of 90–100%, numbers that don’t hold up under scrutiny.
At every IIoT Technologies implementation we’ve done, using automated, real-time tracking of all three OEE components, we see the same pattern:
Real OEE is often up to 50% lower than what the factory had been reporting.
And the best part? Once leadership sees the true performance, they act. We’ve seen teams go from shock to improvement, raising true OEE by 30–80% within months, simply by working from accurate data.