In the fast-paced world of manufacturing and production, unplanned downtime and inefficiencies can significantly affect profitability. Every minute of machine stoppage means lost production, missed deadlines, and unnecessary costs. IIOT Technologies addresses this challenge by providing smart industrial solutions that not only identify inefficiencies but also help you act on them in real-time.
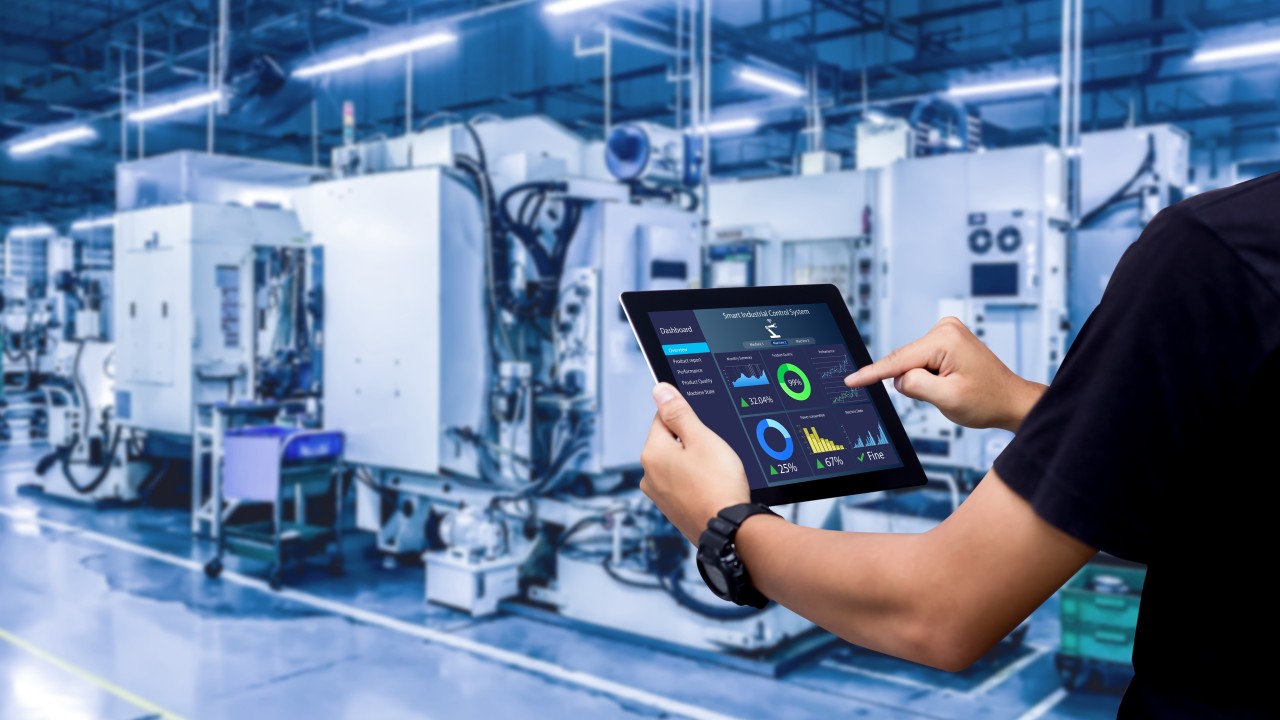
At the heart of IIOT Technologies platform is its ability to track and improve Overall Equipment Effectiveness (OEE)—a critical metric that combines machine availability, performance, and quality. With real-time monitoring, users get immediate insights into when, where, and why downtime occurs. This allows operators and managers to take quick corrective actions before minor issues escalate into major disruptions. Whether it’s a breakdown, idle machine, or delay in material supply, the system pinpoints root causes so you can eliminate recurring problems.
Beyond OEE tracking, IIOT Technologies enhances manpower productivity by streamlining workflows and reducing manual errors. Through digital dashboards and automated alerts, workers are better guided to respond efficiently to problems. The system also supports optimal scheduling and workload balancing, ensuring that human resources are utilized effectively without overburdening teams or leaving machines unattended.
Additionally, the platform fosters a data-driven culture where continuous improvement becomes a part of the daily routine. Historical reports and trend analysis enable strategic decisions, helping manufacturers not only reduce downtime but also make informed investments in maintenance, training, or process upgrades.
By leveraging IIOT Technologies, companies can shift from reactive to proactive operations—reducing unplanned downtime, maximizing equipment utilization, and boosting overall output. It's not just about collecting data; it’s about translating that data into smarter actions and measurable improvements.
Key Highlights:
📈 OEE & Availability Dashboards
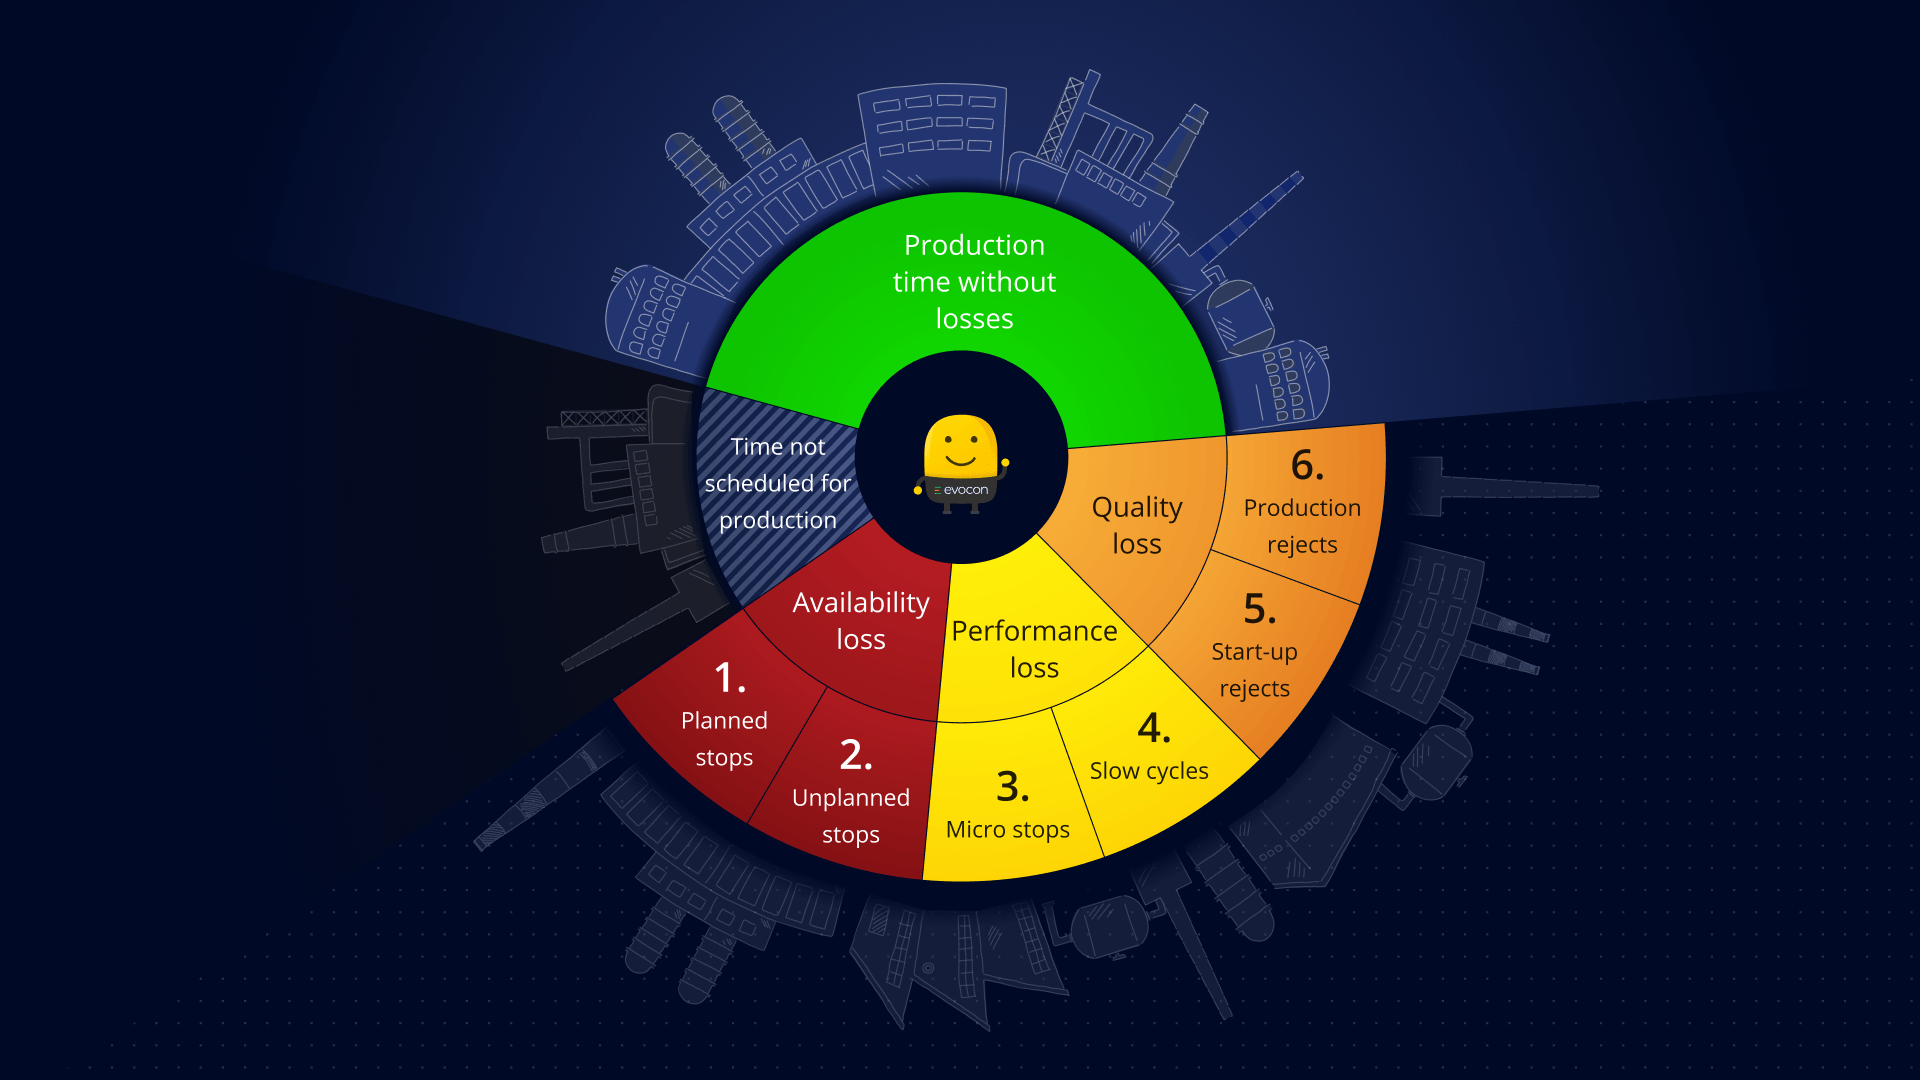
Our OEE & Availability Dashboards provide real-time insights into your machine’s actual performance compared to ideal targets. Visualize key metrics like uptime, downtime, speed, and quality through intuitive waterfall-style breakdowns that clearly illustrate how each factor impacts overall equipment effectiveness. Quickly identify bottlenecks, track losses, and prioritize improvements to maximize productivity and minimize unplanned downtime. Empower your team with data-driven decisions for continuous operational excellence.
These dashboards consolidate complex data into easy-to-understand visualizations, enabling you to pinpoint the root causes of performance gaps at a glance. By breaking down Availability, Performance, and Quality losses step-by-step, waterfall charts help reveal exactly where time and productivity are being lost. This transparency not only aids in rapid troubleshooting but also supports ongoing process optimization, helping manufacturers achieve higher efficiency and greater return on investment.
🧰 Downtime Pareto & Root Cause Analysis
Downtime Pareto charts are powerful tools that help manufacturers identify the most frequent and impactful causes of equipment stoppages. By visually ranking downtime events from most to least significant, these charts enable teams to focus their efforts on the few critical issues that contribute to the majority of production losses. This targeted approach ensures that resources are efficiently allocated to solve problems that will yield the greatest improvements in machine availability and overall productivity.
Root Cause Analysis (RCA) goes a step further by digging into why these downtime events occur in the first place. Combining Pareto insights with RCA techniques allows teams to uncover underlying issues—whether they’re related to equipment failures, operator errors, or process inefficiencies—and implement effective corrective actions. Together, Downtime Pareto charts and Root Cause Analysis empower manufacturers to reduce unplanned stoppages, improve maintenance strategies, and drive continuous operational excellence.
🔁 Rework Tracking & MTTR/MTBF Metrics
Tracking rework events is essential to understanding the impact of quality issues on overall production efficiency. By logging every instance where products must be corrected or remanufactured, manufacturers can quantify the frequency and scale of defects that disrupt workflow. This visibility helps pinpoint recurring quality problems, allowing teams to address root causes and reduce the need for costly rework, which ultimately improves throughput and customer satisfaction.
MTTR (Mean Time To Repair) and MTBF (Mean Time Between Failures) are critical metrics that provide deeper insight into equipment reliability and maintenance effectiveness. MTTR measures the average time required to restore a machine after a failure, highlighting how quickly the maintenance team can respond and fix issues. MTBF, on the other hand, tracks the average operational time between breakdowns, indicating the overall durability and stability of equipment. Together, these metrics enable data-driven decisions for optimizing maintenance schedules, improving machine uptime, and enhancing production continuity.
👥 Workforce & Line Efficiency Tools
Workforce and Line Efficiency Tools enable manufacturers to monitor and compare planned versus actual workforce output in real time. By analyzing key productivity indicators, such as labor hours, shift performance, and unit output per worker, these tools help uncover inefficiencies in staffing or process execution. Managers can quickly identify underperforming lines or shifts and take corrective actions to align performance with production targets. This level of visibility supports more accurate forecasting and capacity planning.
Beyond just monitoring, these tools also offer dynamic workload balancing by redistributing tasks based on real-time conditions. Whether it's adjusting labor allocation to accommodate machine bottlenecks or reassigning personnel to higher-priority areas, this adaptability ensures optimal utilization of human resources. By combining workforce analytics with machine performance data, manufacturers can foster collaboration between people and processes—leading to a more agile, responsive, and productive manufacturing environment.
🧪 Trial Mode for Simulated Runs
Trial Mode for Simulated Runs empowers manufacturers to experiment with process adjustments, shift changes, or new production parameters in a risk-free environment. By simulating real-world conditions without disrupting live operations, teams can evaluate the potential impact of changes on efficiency, output, and downtime before implementation. This feature supports data-driven decision-making and continuous improvement by reducing the trial-and-error cost typically associated with production adjustments.